Day-0,1: Data Preperation and Introduction to ggplot2

Data transformation and introduction to ggplot2
Author

Arvind Iyer, PhD

Published

October 15, 2024

Data Preparation

Before visualizing data in R, you need to import it from an external source and format it properly. Ideally, data would come in a clean, error-free, rectangular format with no missing values, but that’s rarely the case. In reality, data often requires cleaning and transformation to be useful for analysis. This process might involve handling missing data, correcting errors, restructuring columns, or converting data types. Proper preparation is key to ensuring that your visualizations accurately reflect the underlying patterns and insights in your data. A very import part of the data science life cycle.

Importing data into R

R can import data from almost any source, including text files, excel spreadsheets etc. How do we do it? It is simple:

# Load the library
library(tidyverse)
── Attaching core tidyverse packages ──────────────────────── tidyverse 2.0.0 ──
✔ dplyr     1.1.4     ✔ readr     2.1.5
✔ forcats   1.0.0     ✔ stringr   1.5.1
✔ ggplot2   3.5.1     ✔ tibble    3.2.1
✔ lubridate 1.9.3     ✔ tidyr     1.3.1
✔ purrr     1.0.2     
── Conflicts ────────────────────────────────────────── tidyverse_conflicts() ──
✖ dplyr::filter() masks stats::filter()
✖ dplyr::lag()    masks stats::lag()
ℹ Use the conflicted package (<http://conflicted.r-lib.org/>) to force all conflicts to become errors
Salaries <- read_csv(file = 'data/Salaries.csv')
Rows: 397 Columns: 6
── Column specification ────────────────────────────────────────────────────────
Delimiter: ","
chr (3): rank, discipline, sex
dbl (3): yrs.since.phd, yrs.service, salary

ℹ Use `spec()` to retrieve the full column specification for this data.
ℹ Specify the column types or set `show_col_types = FALSE` to quiet this message.
Salaries <- read_tsv(file = 'data/Salaries.txt')
Rows: 397 Columns: 6
── Column specification ────────────────────────────────────────────────────────
Delimiter: "\t"
chr (3): rank, discipline, sex
dbl (3): yrs.since.phd, yrs.service, salary

ℹ Use `spec()` to retrieve the full column specification for this data.
ℹ Specify the column types or set `show_col_types = FALSE` to quiet this message.
# To know more about these function (any function) to check arguments of these functions.
help("read_csv") # ?read_csv ?function would also show the help page.
Cleaning data

The most time consuming part. For this we use tidyR and dplyr packages. There are other ways to do the same. We will use Salaries data set (information about professor’s salaries) for doing these tasks:

  • Use select function to select some variables (columns)
  • Use mutate function to create a new variable.
  • Use count function to count a variable
# First lets get a glimpse of the data
glimpse(Salaries)
Rows: 397
Columns: 6
$ rank          <chr> "Prof", "Prof", "AsstProf", "Prof", "Prof", "AssocProf",…
$ discipline    <chr> "B", "B", "B", "B", "B", "B", "B", "B", "B", "B", "B", "…
$ yrs.since.phd <dbl> 19, 20, 4, 45, 40, 6, 30, 45, 21, 18, 12, 7, 1, 2, 20, 1…
$ yrs.service   <dbl> 18, 16, 3, 39, 41, 6, 23, 45, 20, 18, 8, 2, 1, 0, 18, 3,…
$ sex           <chr> "Male", "Male", "Male", "Male", "Male", "Male", "Male", …
$ salary        <dbl> 139750, 173200, 79750, 115000, 141500, 97000, 175000, 14…
# Use select function to select rank and discipline columns
subset <- Salaries %>% select(rank,discipline)
subset
# A tibble: 397 × 2
   rank      discipline
   <chr>     <chr>     
 1 Prof      B         
 2 Prof      B         
 3 AsstProf  B         
 4 Prof      B         
 5 Prof      B         
 6 AssocProf B         
 7 Prof      B         
 8 Prof      B         
 9 Prof      B         
10 Prof      B         
# ℹ 387 more rows
# Use mutate to create a new column color using discipline where A:red and B:blue  
subset %>% mutate(color=ifelse(discipline=='A','red','blue'))
# A tibble: 397 × 3
   rank      discipline color
   <chr>     <chr>      <chr>
 1 Prof      B          blue 
 2 Prof      B          blue 
 3 AsstProf  B          blue 
 4 Prof      B          blue 
 5 Prof      B          blue 
 6 AssocProf B          blue 
 7 Prof      B          blue 
 8 Prof      B          blue 
 9 Prof      B          blue 
10 Prof      B          blue 
# ℹ 387 more rows
#Use count function to count ranks
Salaries %>% count(rank)
# A tibble: 3 × 2
  rank          n
  <chr>     <int>
1 AssocProf    64
2 AsstProf     67
3 Prof        266

Must read and try to go through Data Transformation section of this book

Do a read of chapter-2 of this book.

Data Visualization

Introduction

R offers multiple systems for creating graphs, but one of the most powerful and flexible is ggplot2.

What is ggplot2?

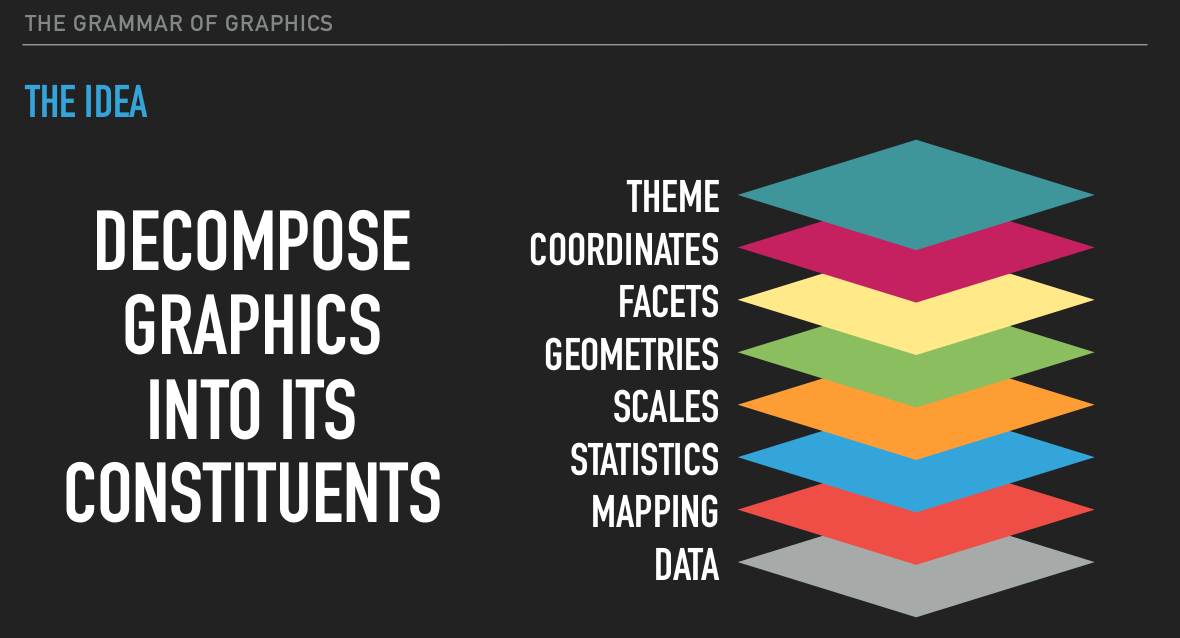
ggplot2 is a data visualization package for R developed by Hadley Wickham that provides a structured approach for visualization. This package is built on the grammar of graphics, a structured approach to designing and constructing visualizations in a consistent and intuitive manner.

Lets see these in action with the famous iris dataset. First let see a summary of the data.

summary(iris)
  Sepal.Length    Sepal.Width     Petal.Length    Petal.Width   
 Min.   :4.300   Min.   :2.000   Min.   :1.000   Min.   :0.100  
 1st Qu.:5.100   1st Qu.:2.800   1st Qu.:1.600   1st Qu.:0.300  
 Median :5.800   Median :3.000   Median :4.350   Median :1.300  
 Mean   :5.843   Mean   :3.057   Mean   :3.758   Mean   :1.199  
 3rd Qu.:6.400   3rd Qu.:3.300   3rd Qu.:5.100   3rd Qu.:1.800  
 Max.   :7.900   Max.   :4.400   Max.   :6.900   Max.   :2.500  
       Species  
 setosa    :50  
 versicolor:50  
 virginica :50  


Figure 1 takes in data as the argument which will generate a empty plot.

ggplot(iris)
Figure 1: Passing data to ggplot2

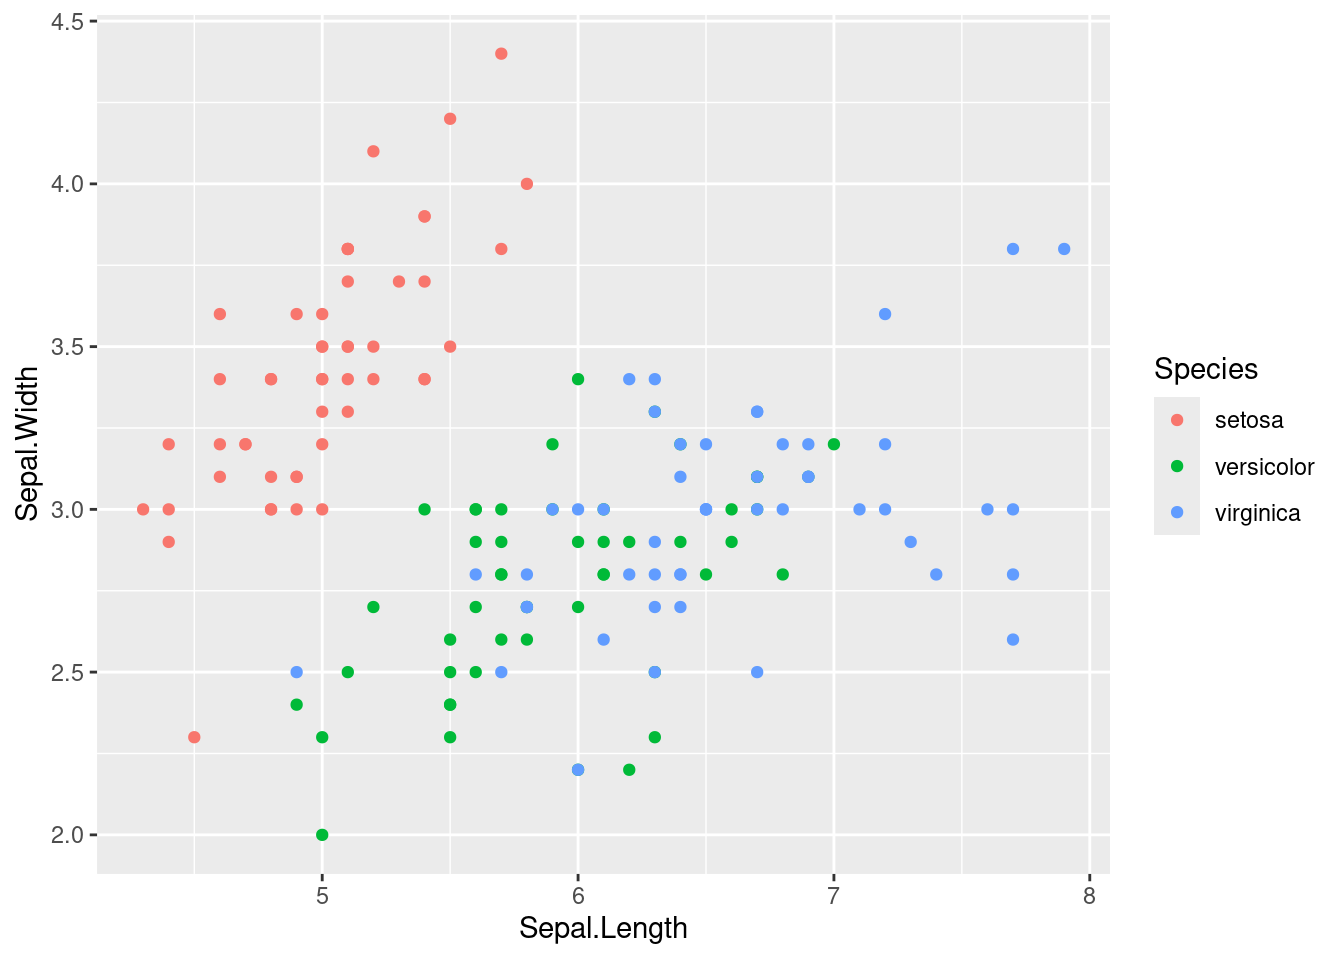
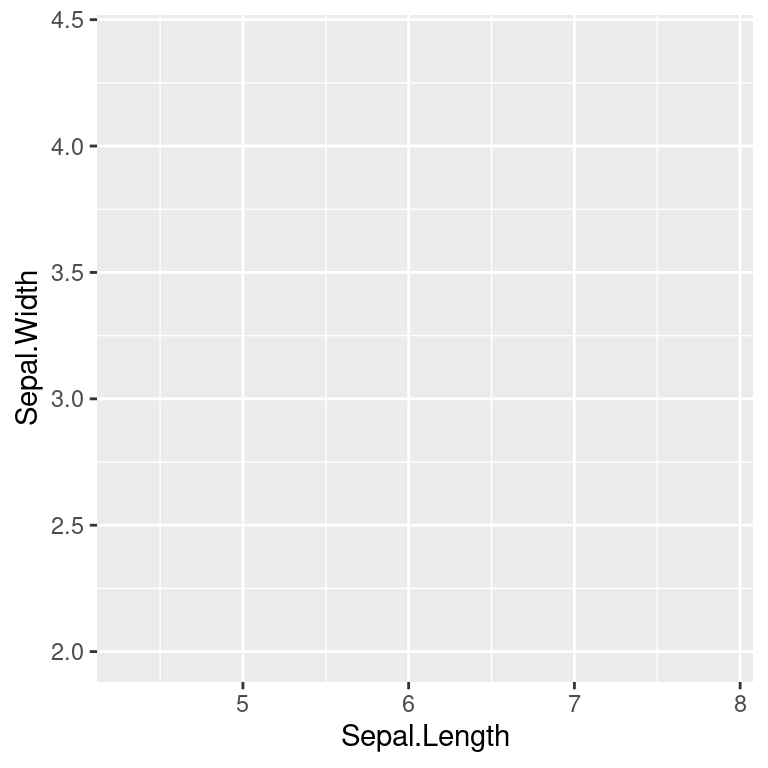
Figure 2 adds Aesthetics to the plot.

ggplot(iris,
      aes(x=Sepal.Length, y=Sepal.Width, 
          color=Species))
Figure 2: Adding Aesthetics

Figure 3 adds Geometries to the plot.

ggplot(iris,
      aes(x=Sepal.Length, y=Sepal.Width, 
          color=Species))+
  geom_point()
Figure 3: Adding Geometries

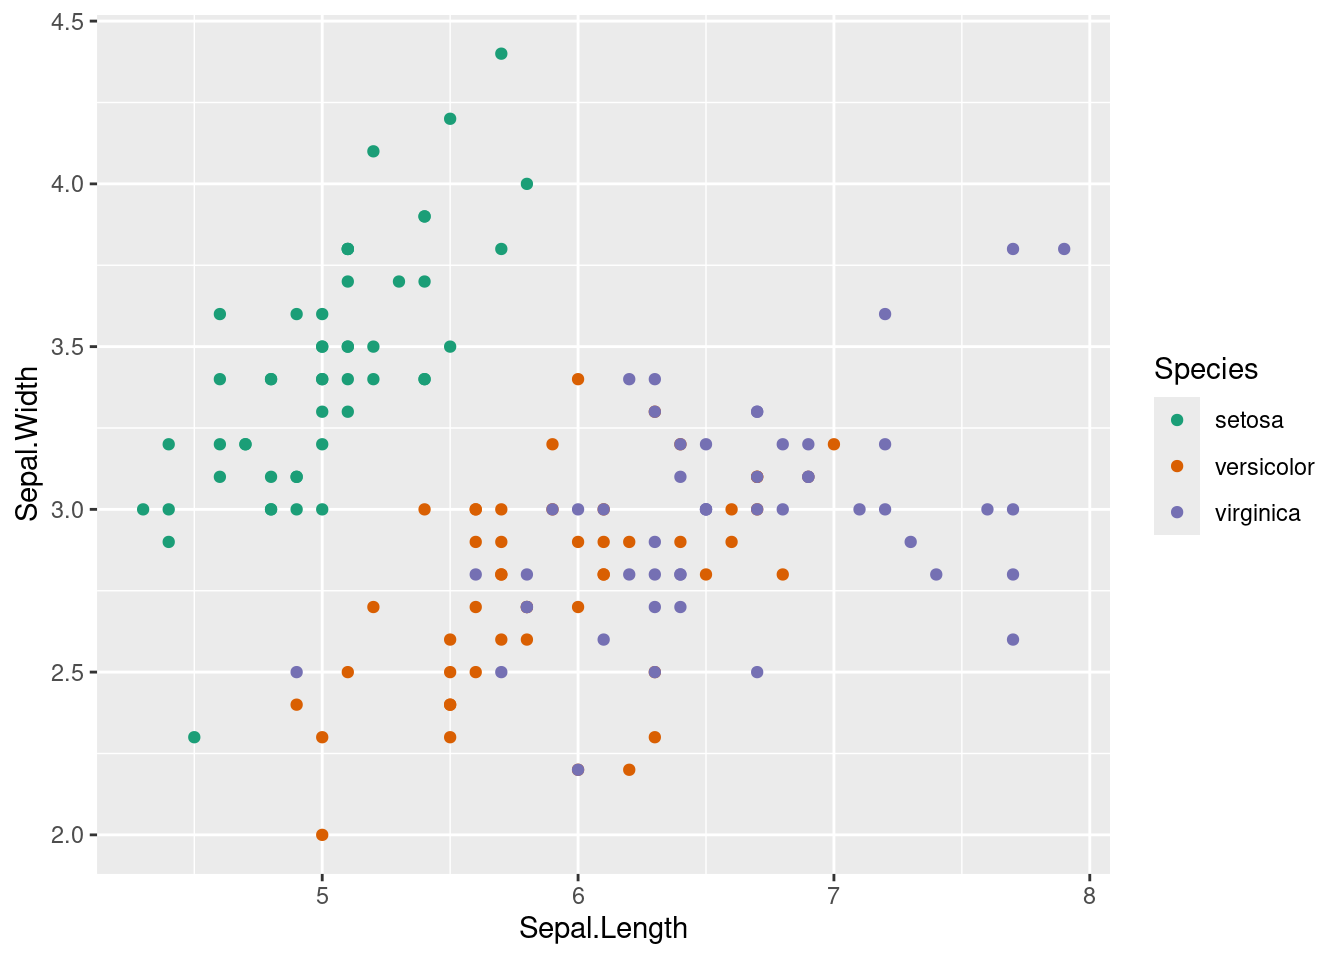
Figure 4 adds Scale to the plot.

ggplot(iris,
      aes(x=Sepal.Length, y=Sepal.Width, 
          color=Species))+
  geom_point()+
  scale_color_brewer(palette = 'Dark2')
Figure 4: Adding Scales

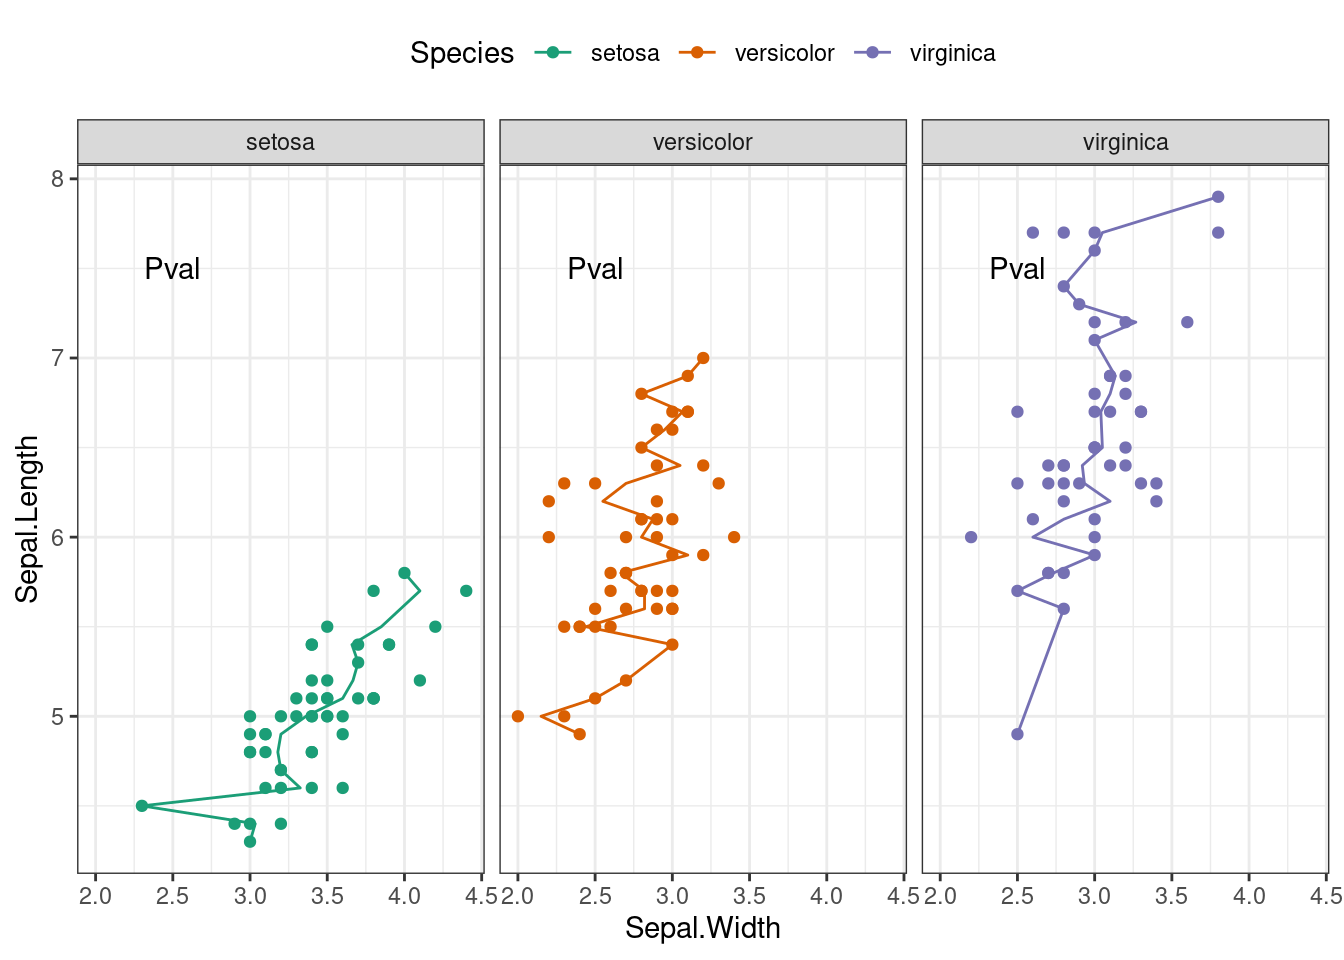
Figure 4 adding Stats,theme,facets to the plot.

ggplot(iris,
      aes(x=Sepal.Length, y=Sepal.Width, 
          color=Species)) +
    geom_point() +
    scale_color_brewer(palette="Dark2") +
    stat_summary(fun.y="mean", geom= "line") + 
    coord_flip() +
    facet_wrap(~Species) +
    theme_bw() + theme(legend.position="top") +
    annotate("text", x=7.5, y=2.5, label="Pval")
Figure 5: Adding Scales

Let’s create a bar plot of variable rank in similar steps on Salaries data.

ggplot(data = Salaries, mapping = aes(x=rank,fill = rank,colour = rank))+
  geom_bar()+
  scale_fill_brewer(palette="Dark2")+
  scale_color_brewer(palette="Dark2")+
  theme_bw() + 
  theme(legend.position="top") 

Creating Bar Plot

References and Additional Materials

For making this tutorial various online resources were used. Mentioning few over here:

Materials

Description Slides Script
1 Introduction

Day_0

Day_1

Day_1
Back to top